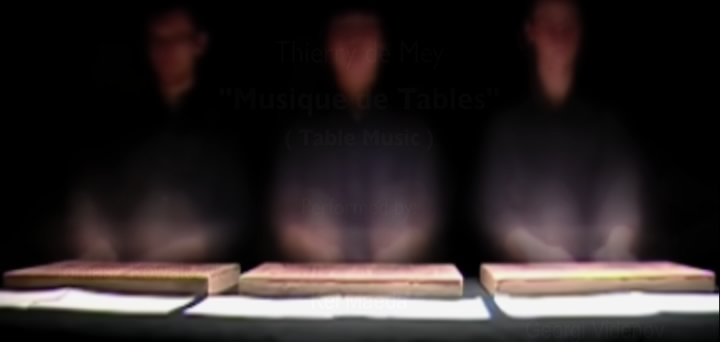
Musique de Table is a wonderful piece written by Thierry de Mey. I have seen it performed live several times, and here came across a one-shot video recording that I thought it would be interesting to analyse:
The test with some video visualization tools in the Musical Gestures Toolbox for Python.
For running the commands below, you first need to import the toolbox in Python:
import musicalgestures as mg
I started the process by importing the source video:
video = mg.MgVideo('table_music.mp4')
Then, I generated an average image:
video.average()
and videograms:
video.videograms()
Here is an image showing the average image top and vertical videogram below (time running from top to bottom):

The videogram gives a sense of the temporal development of the piece, but I also wanted to see how it works by running the same processes on a motion video. The motion video can be generated like this:
video.motion().average()
Here I also included the average() function at the same time to save some processing time. The motion() function is based on frame-differencing the video, and it saves some time by computing the motiongrams and average image in the same process. The resultant motion video looks like this:
And the motion average image and vertical motiongram (again, time runs from top to bottom) looks like this:

The motiongram shows more clearly what changed over time. However, the full motiongram does not reveal all the details. Below is a close-up of the ending of the piece:

It is remarkable to see the timing and the complexity of the performance. If you are interested in exploring such visualizations more yourself, check out the Musical Gestures Toolbox for Python. And if you are not into programming, you can try the easy-to-use VideoAnalysis app (Mac/Win).