For my annual Still Standing project, I am recording sensor data from my mobile phone while standing still for 10 minutes at a time. This is a highly curiosity-driven and data-based project, and part of the exploration is to figure out what I can get out of the sensors. I have started sharing graphs of the linear acceleration of my sessions with the tag #StillStanding on Mastodon. However, I wondered if this is the sensor data that best represents the motion. Since my still standing is, well, quite still, I have conducted a short test with some more movement.
Data collection
The data has been captured with the Physics Toolbox Sensor Suite app developed by Vieyra Software. From there, I exported a CSV file that I imported into a Jupyter Notebook for further analysis in Python. The sensor data and analysis files can be found on GitHub.
The sequence I am analyzing here is based on the following tasks:
- Phone lying still on the table
- Hanging phone around the neck
- Moving back and forth ten times
- Moving sideways ten times
- Moving up and down ten times
- Putting the phone back on the table
- Phone lying still on the table
This should give me enough information to understand more about the directions of the sensor data and how well the different sensors pick up information.
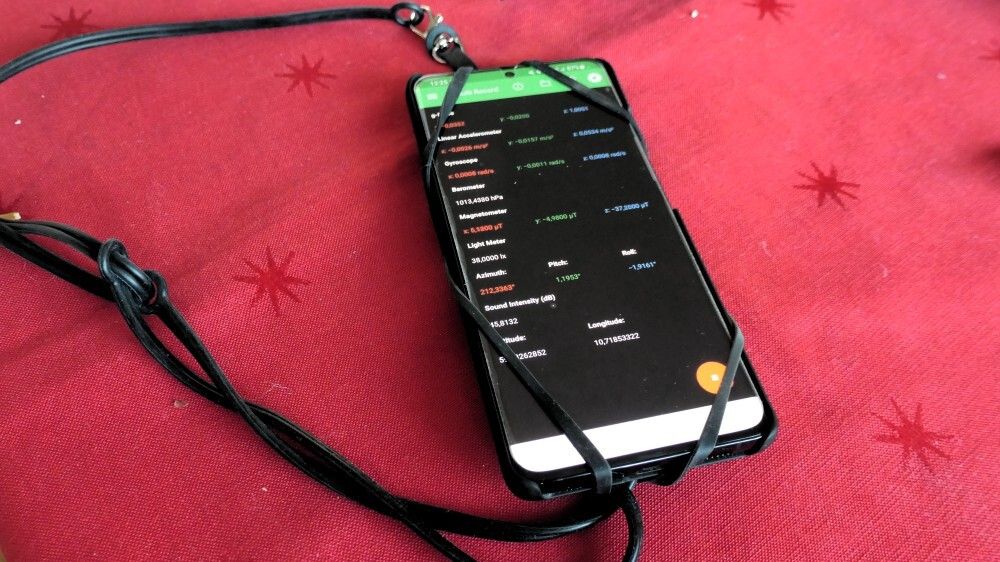
Here is a photo of the phone hanging around my neck, using the same hanging system we developed for MusicLab Copenhagen.

Linear acceleration
The “linear acceleration” data from the app are not based on a single sensor reading. Vieyra explains that it is “derived from the g-force meter, but also uses the gyroscope and the magnetometer to negate the effects of the earth’s gravitational field on the sensor.” This sensor value represents when the mobile phone “speeds up, slows down, or changes direction. When the mobile device is at rest with respect to the surface of the earth, it reads acceleration values of 0, 0, 0.”
A plot of my sequence looks like this:

From this, I can see that the XYZ values are indeed close to (0,0,0) when the phone lies still in the beginning and end. I am more confused about the directions of the axes. From motion capture devices, I am used to the Z-axis representing up-down, but from the plots, we can see the three directions:
- Z-axis: back–forth (anteroposterior)
- Y-axis: sideways (mediolateral)
- X-axis: up–down (sagittal)
The three axes are clearly separated. It is interesting to see that there is also some activity in the X-axis for the back-forth motion. This is because I necessarily had to move slightly up and down while rocking back and forth.
Gravitational force
I was curious to see how the “linear acceleration” data compared to the “g-force” data, which is the sensor data coming out of the accelerometer in the mobile phone. This is a sensor I am familiar with, and where I expect that the sensor data has a readout of (0,0,1) when lying still. This can be seen in the plots, where the Z-axis is approximately 1 when the phone was lying still in the beginning and end:

As expected, the data look pretty similar to the “linear acceleration”, albeit without the corrections made in the software. Also, it is easy to differentiate between the different motion types.
Gyroscope
A gyroscope measures the rotational velocity of the mobile phone. It is interesting to see that it picks up the rotation in my upper body during the back-forth rugging (Y axis) and also some of the lateral rotation (Z axis):

There was not much rotation when I moved up and down, so there is little to report.
Magnetometer
The magnetometer measures the magnetic field in three dimensions and can also be used to measure the total magnetic field. It picked up the back-forth motion (Z-axis) and some sideway motion (X-axis).

Since this sensor is based on the magnetic field, it is not strange that not much happened during the up-down motion. It is more confusing why the readouts at the beginning and end are different. I expected it would return the same data when the phone was lying still.
Inclinometer
It appears that what Vieyra captures as “inclinometer” data is derived from the accelerometer data. They write:
The inclinometer uses data from the g-force meter while the mobile device is held at rest […] When the mobile device is held parallel to the x, y, or z plane, such as when it is held flat, all of the gravitational force is sensed in a single direction. When the phone is tilted out of the plane in any direction, the gravitational force now appears as components in each of the planes. These components are calculated using standard trigonometry to determine the angle at which the mobile device is held.
The data returned is not particularly useful in my case:

They claim that the inclinometer data is based on the accelerometer (used for the “G force” readout). However, the shift of values between the beginning and end looks similar to the magnetometer data. So I suspect that they do some sensor fusion in this calculation. In any case, these data are not of much interest to me.
Summing up
It was helpful to make this comparison of data. Some data appear to be coming straight from the sensors, while others are derivatives. In any case, I think the “linear acceleration” data will work well for my purpose. In the past, I have worked directly with accelerometer data, what Vieyra calls “G force” data, and also done sensor fusion between accelerometer, gyroscope, and magnetometer myself. They have done an excellent job integrating these data in their “linear acceleration” measure, so I will continue using that when I report data from my Still Standing sessions.