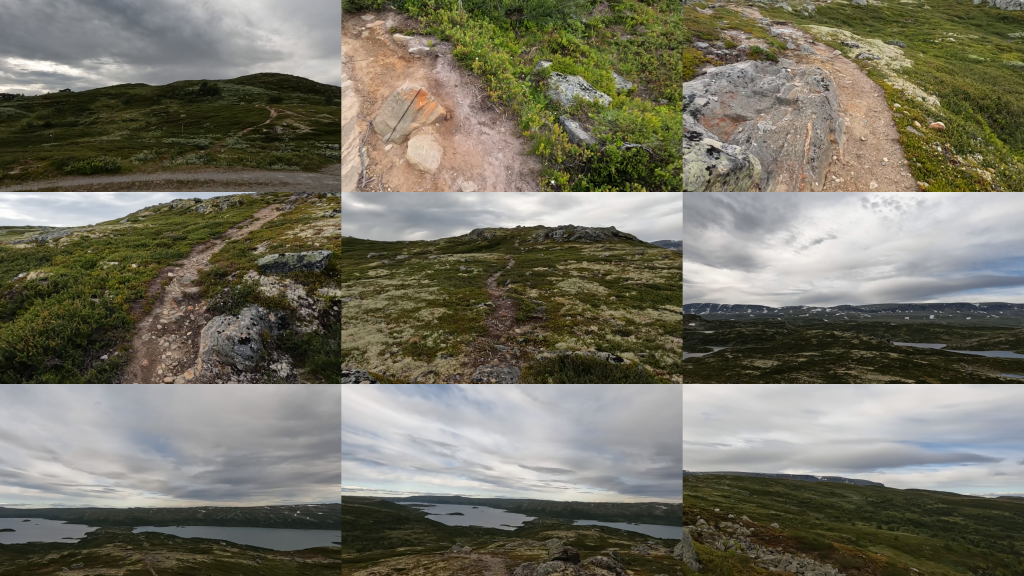
After exploring some visualizations of kayaking, I was eager to see how a similar approach could work for walking. On a trip to the Norwegian mountains, specifically at Haugastøl, situated halfway between Oslo and Bergen, I strapped a GoPro Hero Black 10 on my chest and walked up and down a nearby hill called Storevarden. The walk was approximately 25 minutes up and down, and a fast-forward version of the video can be seen here:
What can one get from the audio and video of such a trip? Here are some results generated with various functions from the Musical Gestures Toolbox for Python.
Static visualizations
The first trial was to create some static visualizations from the video recording.
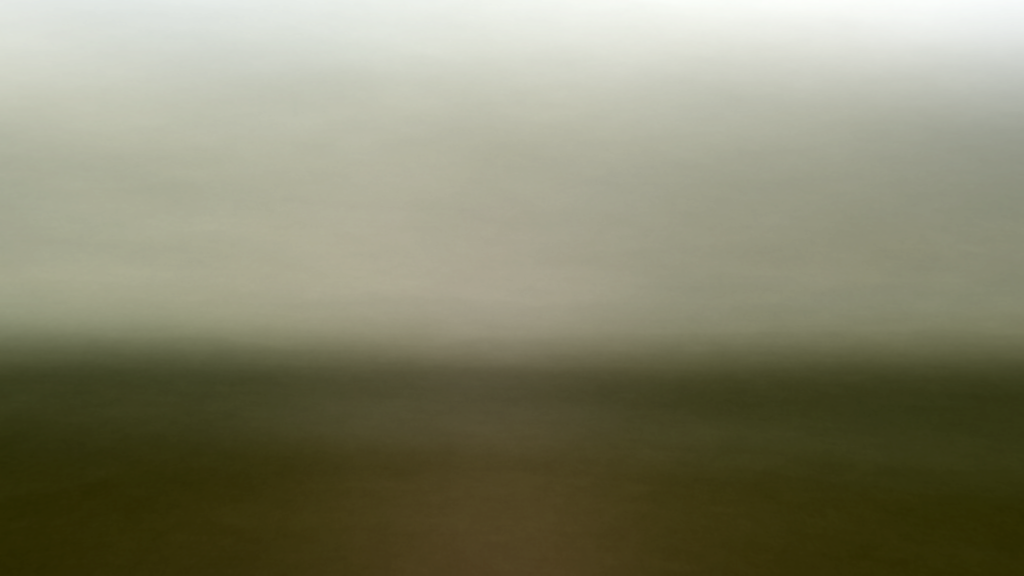
The average image is not particularly interesting in this case. Then it may be better to create a history video that averages images over a shorter period, such as in this video:
A history video is averaging over several seconds of video footage. Still quite shaky, but it creates an interesting soft-focus rendition of the video. This may resemble how I perceived the scenery as I walked up and down.
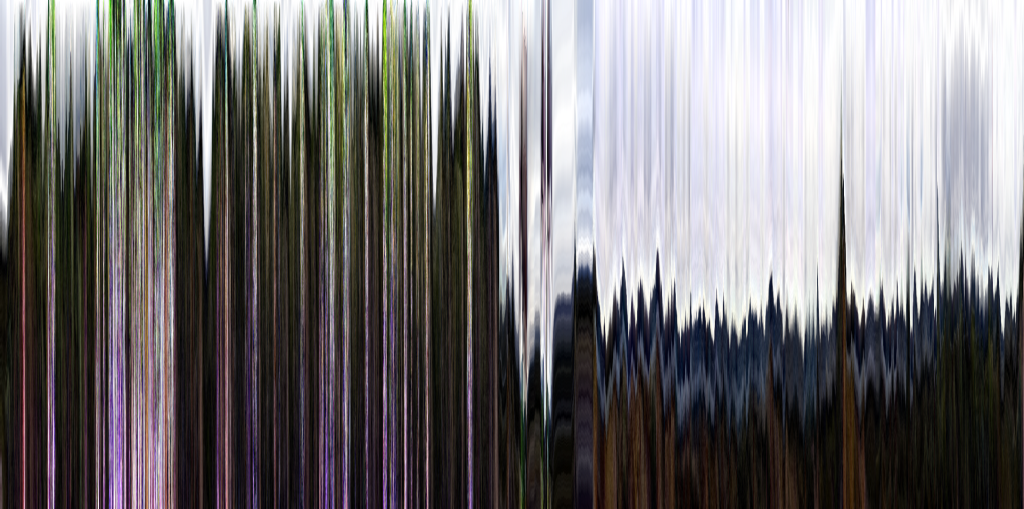
Videograms
A better visualization, then, are the videograms, which give more information about the spatiotemporal features of the video recording.


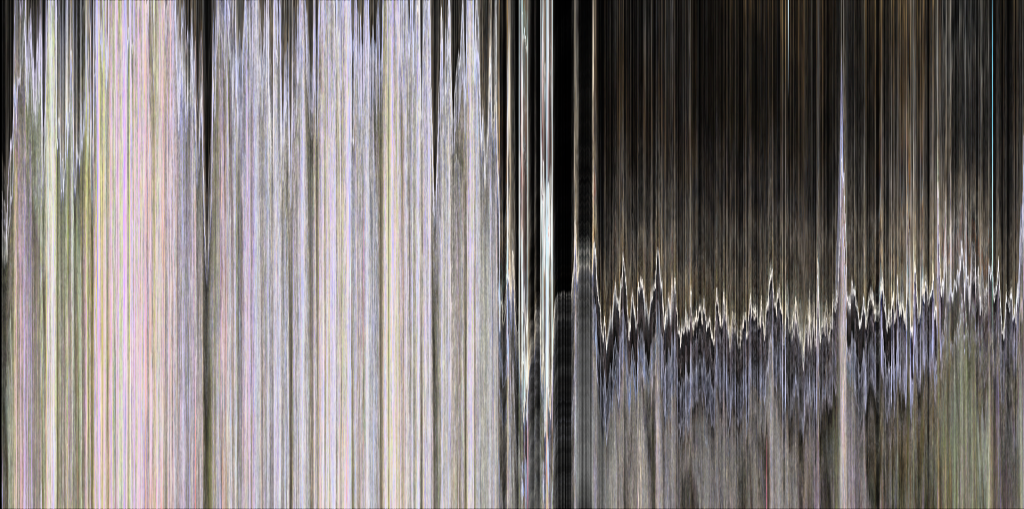
Motiongrams
The videograms are based on collapsing the original images in the video sequence. Motiongrams, on the other hand, collapse the motion image sequence, clearly showing what changed between frames.

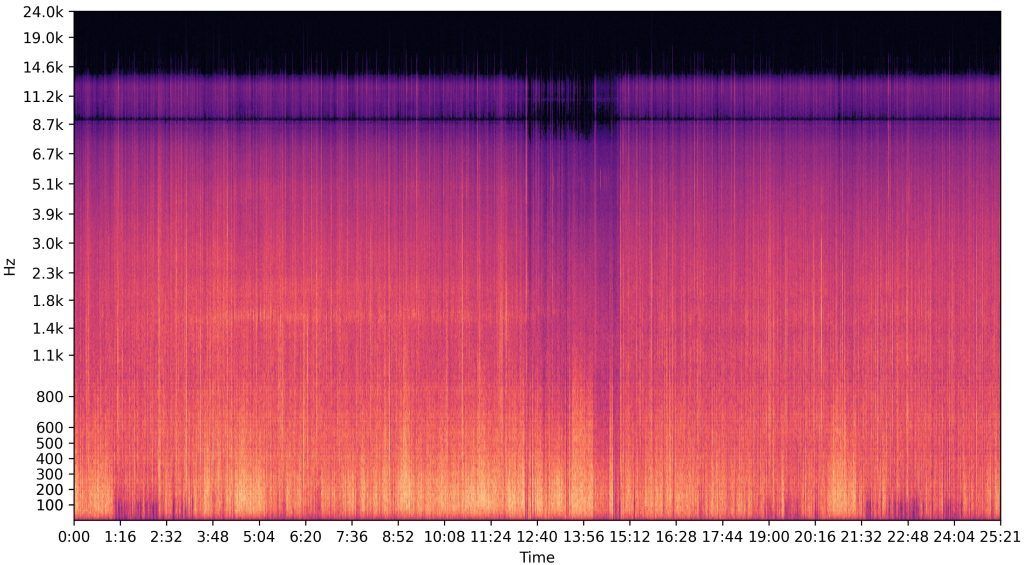
Audio analysis
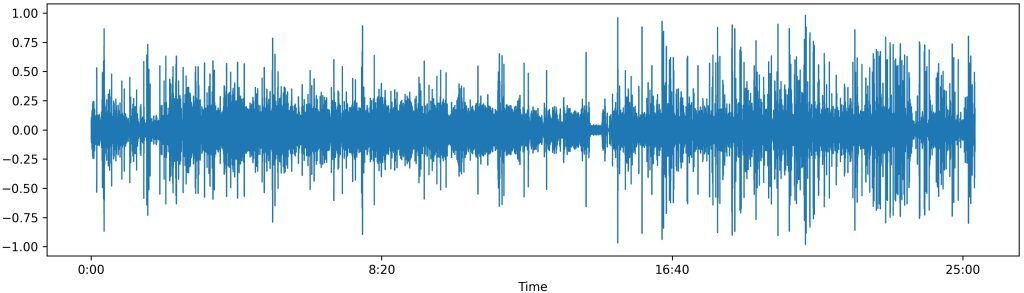
What can one get out of the audio recording of walking? The waveform does not tell much, except that the average levels look higher in the second half (where I was walking down).
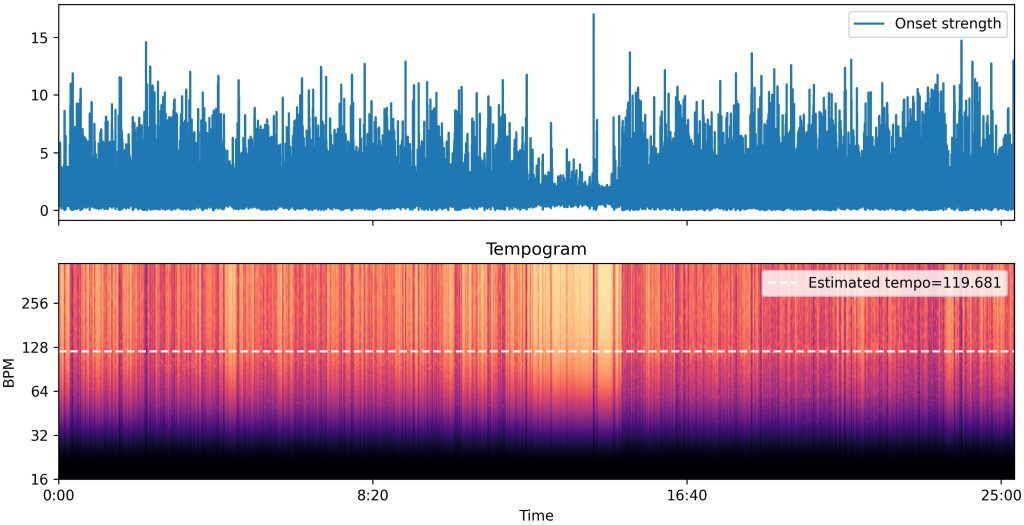
It is fascinating how the estimated tempo of my walking was almost 120 BPM, which happens to be similar to the 2 Hz frequency found in many studies of walking and everyday activities. It will be interesting to try a similar approach for other walking videos.