Yesterday, I posted a blog entry on my TimeLapser application, and how it was used to document the working process of the making of the sculpture Hommage til kaffeselskapene by my mother. The final timelapse video looks like this:
Now I have run this timelapse video through my VideoAnalysis application, to see what types of analysis material can come out of such a video.
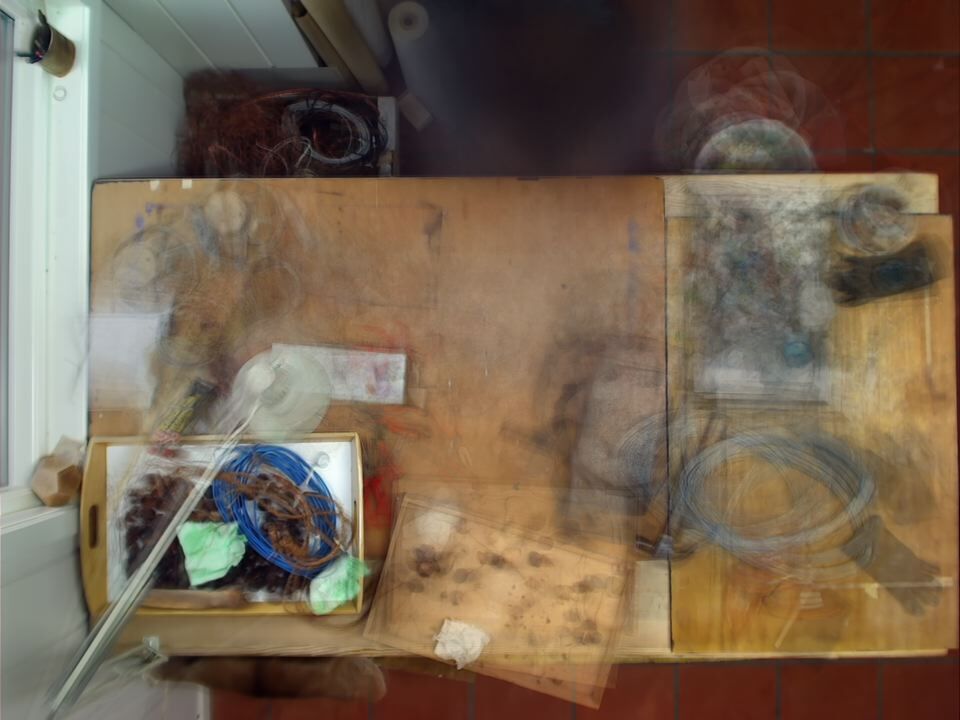
The average image displays a “summary” of the entire video recording, somehow similar to an “open shutter” in traditional photography. This image allows for seeing what has been moving and what has not been moving throughout the entire sequence.
[caption id="" align=“alignnone” width=“300”] Average image [/caption]
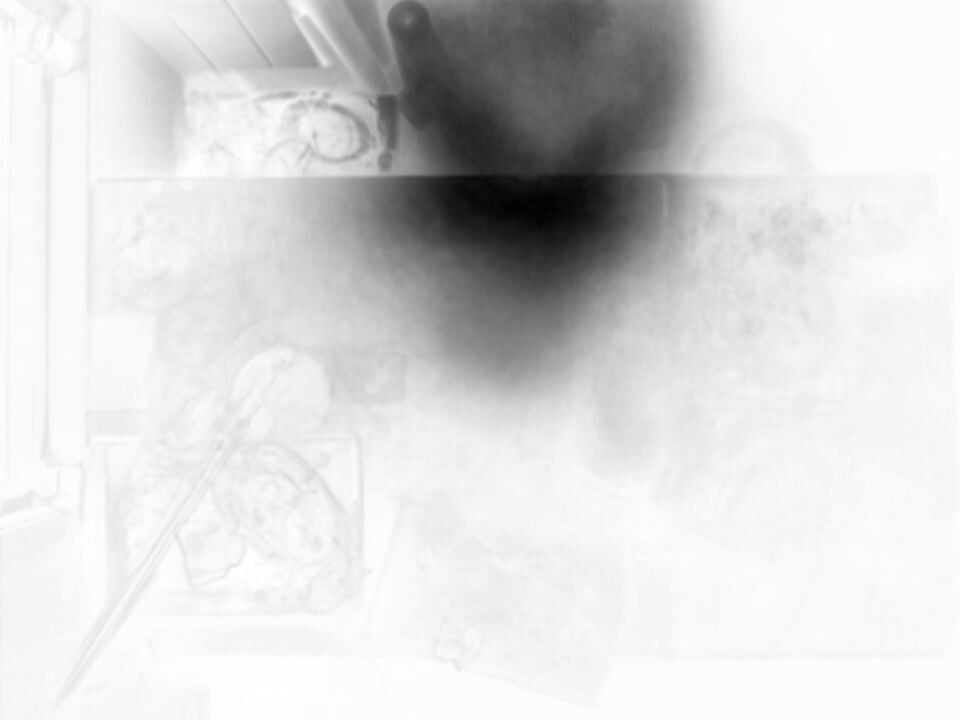
The motion average image is somehow similar to the average image, but it summarises the motion images through the entire sequence, that is, only the parts of the image that changed.
[caption id="" align=“alignnone” width=“300”] Motion average image[/caption]
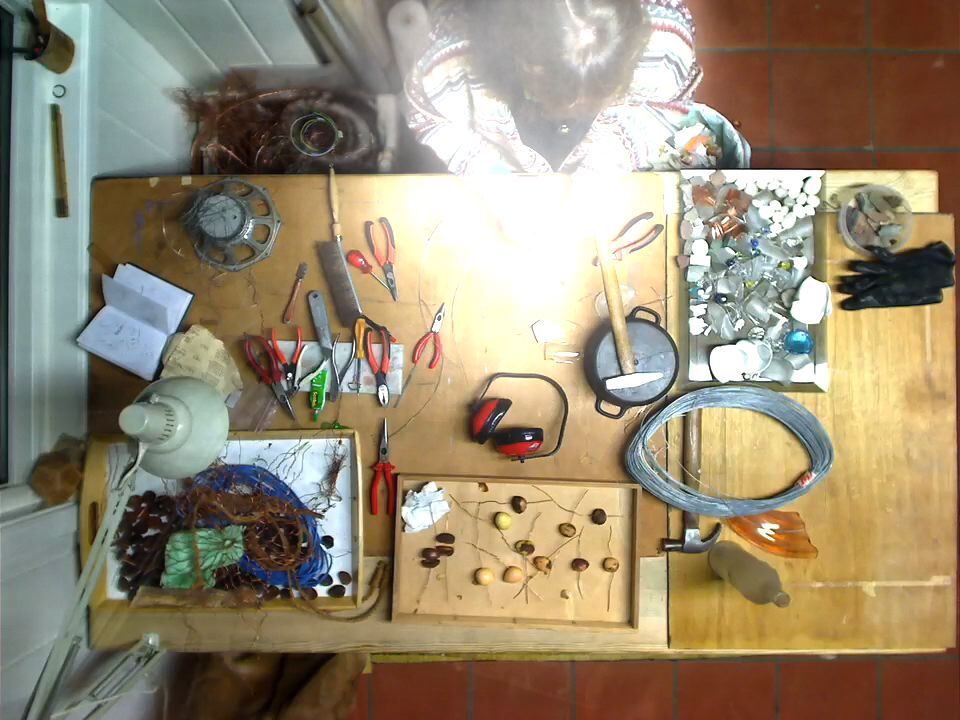
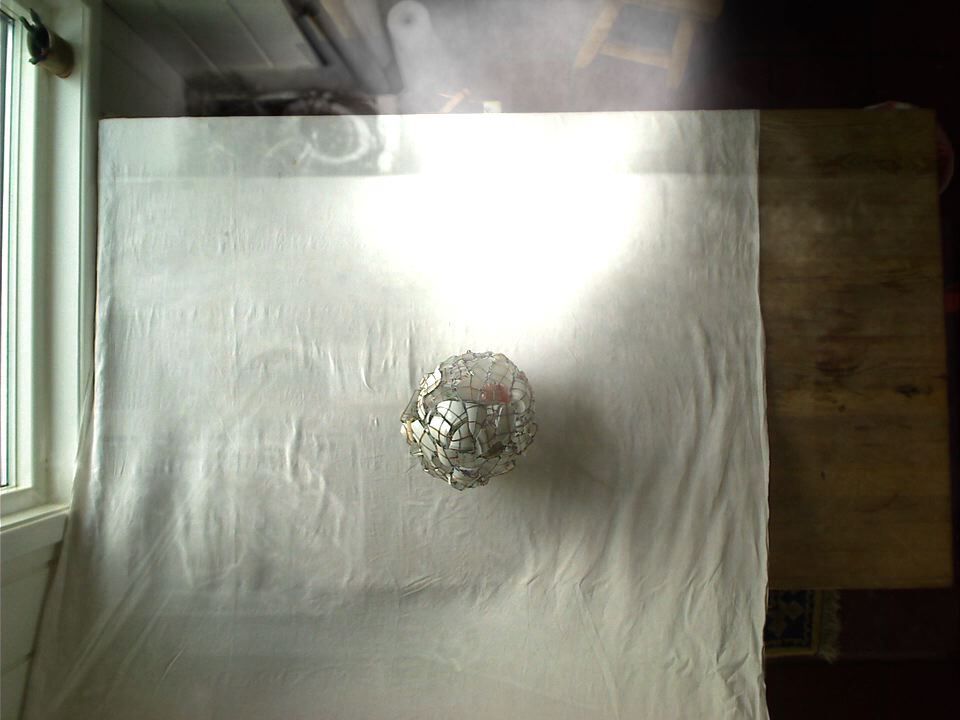
What I call a motion history image, is the motion average image overlaid only a single frame from the original video. I typically create such motion history images using both the first and last frames of the video, as can be seen below.
[caption id="" align=“alignnone” width=“300”] Motion history image, based on first video frame[/caption]
[caption id="" align=“alignnone” width=“300”] Motion history image, based on last video frame[/caption]
Finally, I have also created both horisontal and vertical motiongrams of the timelapse video. The horisontal motiongram displays the vertical motion, which in this case is how the sculptor moved back and forth when sitting at the table. The edge of the table can be seen as the “stripe” running throughout the image.
[caption id="" align=“alignnone” width=“300”] Horisontal motiongram, displaying vertical motion[/caption]
The vertical motiongram, on the other hand, displays horisontal motion, that is, how the artist moved sideways throughout the process. Here it is very interesting to note the rhythmic swaying pattern, as the sculptor moved back and forth in what seems to be a periodic pattern.
[caption id="" align=“alignnone” width=“99”] Vertical motiongram, displaying horisontal motion[/caption]
I also have some more motion data, which it will be interesting to study in more detail in Matlab.